Install the app
How to install the app on iOS

Follow along with the video below to see how to install our site as a web app on your home screen.

Note: This feature may not be available in some browsers.

DS224+ Very Slow

7
1
NAS
DS224+
Operating system
  1. Windows
Mobile operating system
  1. Android
Hello.

I upgraded from a DS216j to a DS224+ recently as my DS216j was intolerably slow, however after upgrading and spending a lot of time configuring things, I am now finding this DS224+ to also be intolerably slow!

By slow I mean it takes several minutes to login to DSM, and once logged in takes 45 seconds to open Control Panel or Resource Monitor or anything. By enlarge I am a rather patient person but this is just infuriating to work with, and surely this can't be the normal experience. I also have a Jellyfin server running and it takes ages for thumbnails and things to render in Jellyfin.

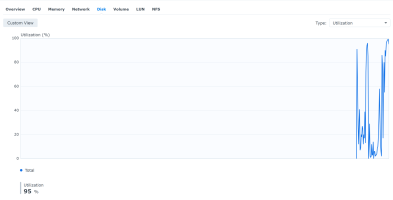
When checking Resource Monitor, on the CPU page, I see a surprisingly high I/O Wait percentage (frequently over 90%). Is this normal?

I can also hear my hard-drives constantly grinding, day and night without stop. Is this normal as well?

My drives are duplicated and "Healthy" and currently at 83% capacity, which I know is near the upper end of the recommended range but shouldn't be causing this kind of unusable performance should it?

It's worth noting that once media does start playing (after you've waded through the interminably long selection process) the media itself does actually play smoothly. It's more the incredibly poor response times that are infuriating.

Can anyone suggest how I can workout what's wrong with my system, because as it is it's borderline unusable.


Any assistance will be much appreciated,
Thank you.

This post includes affiliate links. As an Amazon Associate, SynoForum.com may earn a commission if you make a purchase — at no extra cost to you.
It helps support our community! Learn more...

 
Did you migrate the drives from your 216 to 224 i.e. are they using the same drives?
 
I'm pretty sure I did.

When I first switched on my DS224+ (with drives installed) it had a message about migrating from a DS216j and asked if I wanted to do the migration or start again, and I'm pretty sure I chose to do the migration.

The setup I now have on my DS224+ is completely different to what I started with but to answer your question; yes, the drives were used in the DS16j first.
 
The high io wait may be present when the system is still indexing photos. This may take several days, it is worth checking, an progress indicator is visible on the left of the top right task bar, where you can pause/delay the indexing.
The disk activity suggests this as well.
 
I'm pretty sure I did.

When I first switched on my DS224+ (with drives installed) it had a message about migrating from a DS216j and asked if I wanted to do the migration or start again, and I'm pretty sure I chose to do the migration.

The setup I now have on my DS224+ is completely different to what I started with but to answer your question; yes, the drives were used in the DS16j first.
I ask because they are a common factor between the old NAS and the new. Are those drives healthy? Have you run SMART tests on them?
 
The DS224+ should not be responding as slowly as you describe, so it must (as others say) be due to processes that are running for particular reasons. Certainly, my much older DS218+ still feels snappy for it's light duties, mostly being a centralised HB backup point, but also ABB for the Macs. It's my test NAS for trying out stuff too.

One thing, you migrated the drives from your DS216j: I think that NAS had volume constraints of ext4 file system and 16 TB. There are then limits to what you can run on the DS224+, such as: Drive storage usage is much better with btrfs file system; ABB needs btrfs for its storage; and so on. As for the 16 TB volume limit, this doesn't mean you can't add more volumes to use the storage above the 16 TB, provided you enabled multi-volume support when you created the RAID pool.

The Migration Assistant isn't much help when going from one NAS to another, if you want to change storage type, since it recreates the RAID and volume types that are on the source NAS. Rather it is better to do a Hyper Backup and restore this on the new NAS.
 
I upgraded from a DS216j to a DS224+ recently as my DS216j was intolerably slow
If this was a drive migration, you also migrated a 32-bit system, as well as forwent performance advantages that btrfs-formatted 64-bit DSM offers. Maybe it's time for a remigration.
 
So I just restarted the NAS to see if that helped clear things out at all and it doesn't seem much better.

The disk utilisation has been running flat out, varying between about 80 and 100% for the past 3 hours. It has finally settled down a bit, looking more erratic with spikes and troughs rather than pegging at 90-odd percent the whole time:
1759068147704.png
And this is what an HTOP looks like (with column added to DISK ACCESS:
1759063997552.png


And I see that the "Swap" service appears in Task Manager while this is happening with significant values appearing in the "Write" column for it.

However, while there seems to be a strong correlation between "Wait I/IO" and the Disk Utilisation plots:
1759068563135.png


The memory usage doesn't seem to reveal anything significant:
1759068346568.png


I pretty much exclusively use the NAS as a Jellyfin media service, with the ARR suite of packages as support in Docker containers. I don't backup my photo's or anything like that with this service. While I do have qBittorreent running, seeding torrents and alike I wouldn't have thought it would be hammering my drives to the extent I see.


Any idea what might be causing this, or how I could work it out?
 

Attachments

  • 1759063470750.png
    1759063470750.png
    114.3 KB · Views: 19
  • 1759068316368.png
    1759068316368.png
    15.1 KB · Views: 20
I ask because they are a common factor between the old NAS and the new. Are those drives healthy? Have you run SMART tests on them?
Yes, I have run SMART tests (though only the quick test) and both report to be "Healthy":
1759069585100.png
 

Attachments

  • 1759069466087.png
    1759069466087.png
    44 KB · Views: 20
So I just restarted the NAS to see if that helped clear things out at all and it doesn't seem much better.

The disk utilisation has been running flat out, varying between about 80 and 100% for the past 3 hours. It has finally settled down a bit, looking more erratic with spikes and troughs rather than pegging at 90-odd percent the whole time:
View attachment 28598And this is what an HTOP looks like (with column added to DISK ACCESS:
View attachment 28597

And I see that the "Swap" service appears in Task Manager while this is happening with significant values appearing in the "Write" column for it.

However, while there seems to be a strong correlation between "Wait I/IO" and the Disk Utilisation plots:
View attachment 28601

The memory usage doesn't seem to reveal anything significant:View attachment 28600


I pretty much exclusively use the NAS as a Jellyfin media service, with the ARR suite of packages as support in Docker containers. I don't backup my photo's or anything like that with this service. While I do have qBittorreent running, seeding torrents and alike I wouldn't have thought it would be hammering my drives to the extent I see.


Any idea what might be causing this, or how I could work it out?
Looks like a heavy activity on the Docker side of things, according to htop?
 
Looks like a heavy activity on the Docker side of things, according to htop?
Yeah, it does.

I've tried to do some investigation into what Docker's doing there but haven't really been able to learn much from it.

The most I was able to get was this table of the top 5 CPU containers:
ContainerCPUMEMNetIOBlockIO
bazarr0.15%1.6 MiB15.2 MB / 282 kB0B
prowlarr0.06%92.9 MiB168 MB / 894 MB0B
qbittorrent3.10%36.8 MiB46.9 GB / 106 GB0B
jellyfin0.87%405.4 MiB55 MB / 7.92 GB0B
radarr0.99%48.1 MiB1.2 GB / 383 MB0B

For some reason the "BlockIO" is always showing up a "0", so I'm not really able to glean much from it. If these Docker containers are somehow triggering SWAP events though, that could well point to something, but the question still is, "why".

As can be seen from the plot above, while a fair but of the NAS' memory is being used it never gets above 80%.
 
The use of SMR disks like WD60EFAX is not recommended for NAS use. It may be a factor to consider.
 
Rather than trying diagnose the possible issues through thought, why not stop all additional packages and get a baseline performance of just DSM. Then start, one-by-one, enabling packages and at each point assess the impact. When it comes to Container Manager (docker) you could first start up with all containers running: if this is where performance gets hit then disable all containers and re-enable them one-by-one.

There must be some process that is over-utilising resources. A methodical approach may find it.
 

Create an account or login to comment

You must be a member in order to leave a comment

Create account

Create an account on our community. It's easy!

Log in

Already have an account? Log in here.

Similar threads

  • Question Question
That's very similar to DS Audio, which has that same caveat.
Replies
15
Views
423
https://www.reddit.com/r/synology/comments/1pk0nqo/synology_nas_upload_and_download_speeds_very_slow/
Replies
5
Views
838
There is a bug in Synology Routers where, due to ISP Maintenance operations, the Router Ceases to ask...
Replies
3
Views
382
Open up Storage Manager and see if there is any data scrubbing happening. Also, you can schedule those...
Replies
1
Views
446

Thread Tags

Welcome to SynoForum.com!

SynoForum.com is an unofficial Synology forum for NAS owners and enthusiasts.

Registration is free, easy and fast!

Trending content in this forum

Back
Top